

1.1 numpy
1 | # 用 numpy 生成数据 |
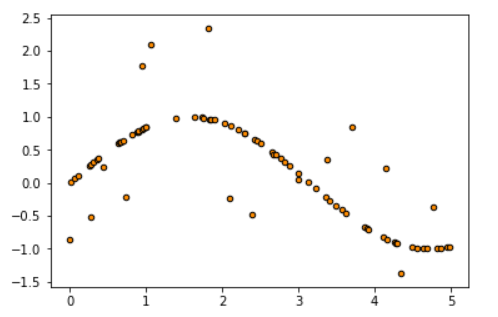
1 | # arange 函数:取数据,前闭后开 |
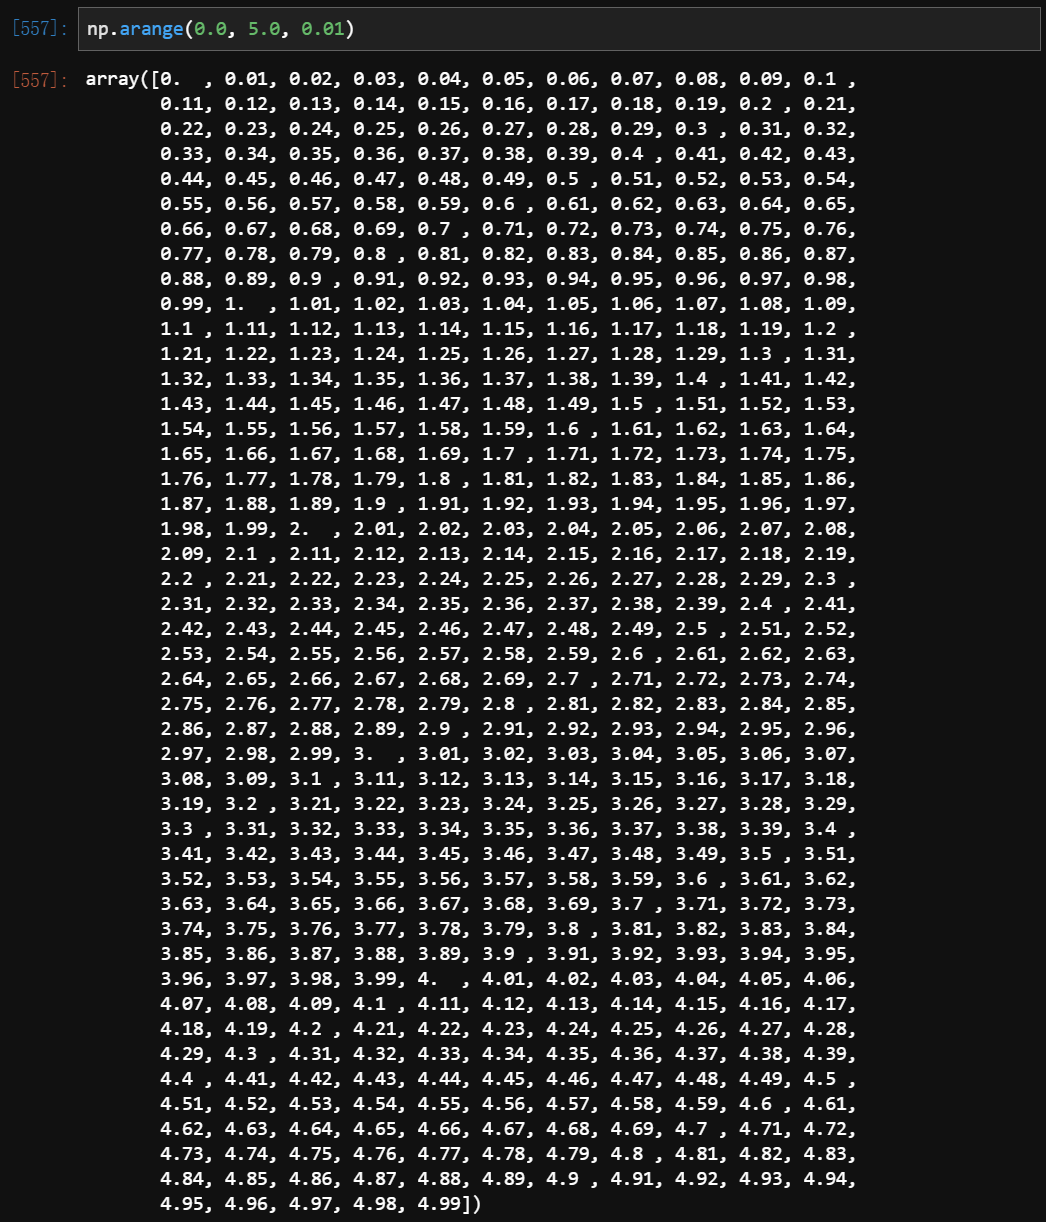
1 | # np.newaxis 的使用:生维函数 |
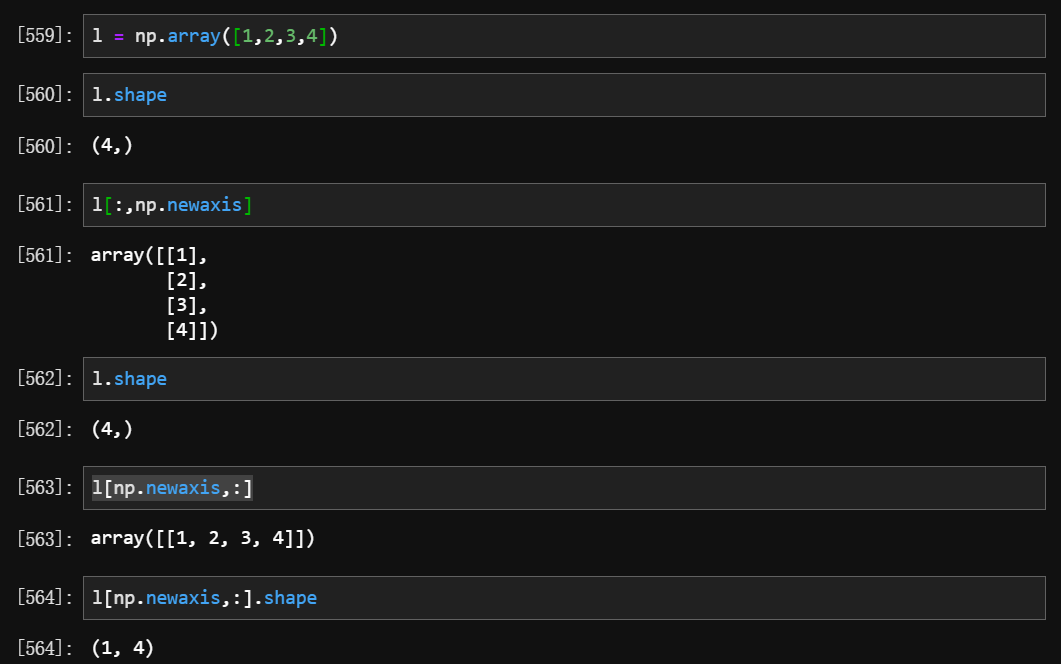
1.2 matplotlib
1 | from matplotlib import matplotlib.pyplot as plt |
例子:
1 | import numpy as np |
- matplotlib 本身不支持中文,原文中提供了 切换中文字体的方法:NumPy Matplotlib | 菜鸟教程
- plot(x ,y ,[fmt]) ,可选参数[fmt] 是一个字符串来定义图的基本属性如:颜色(color),点型(marker),线型(linestyle),例:
plot(x, y, 'bo-')是蓝色圆点实线。
1 | # 准备一张画布 |
1.3 sklearn
1 | # 从 sklearn 中直接生成聚类数据: |
1.4 scipy
安装 sklearn 自动会装上
1 | # 引入scipy 中的距离函数,默认欧氏距离 |
1.5 pandas
1 | import pands as pd |
1.6 tensorflow
1 | import tensorflow as tf |
